Java Memory Management
1. Why Memory Management Matters
Every program needs memory to store data — variables, objects,
method call frames, and more. In languages like C and C++, the
developer is responsible for
manually allocating and freeing memory using
functions like malloc() and
free(). This approach is powerful but
error-prone:
- Memory leaks occur when allocated memory is never freed, causing the program's memory footprint to grow indefinitely.
- Dangling pointers result when code accesses memory that has already been freed.
- Double-free bugs crash the program when the same memory block is freed twice.
Java takes a different approach: the
JVM manages memory automatically. Developers
allocate objects with the new keyword,
and the Garbage Collector (GC) automatically
reclaims memory that is no longer reachable. This eliminates most
memory bugs at the cost of some GC overhead and less deterministic
memory release timing.
Key benefit: Java developers can focus on business logic instead of memory bookkeeping. The JVM guarantees that memory is recycled safely, preventing dangling pointer and double-free bugs entirely.
2. JVM Memory Areas
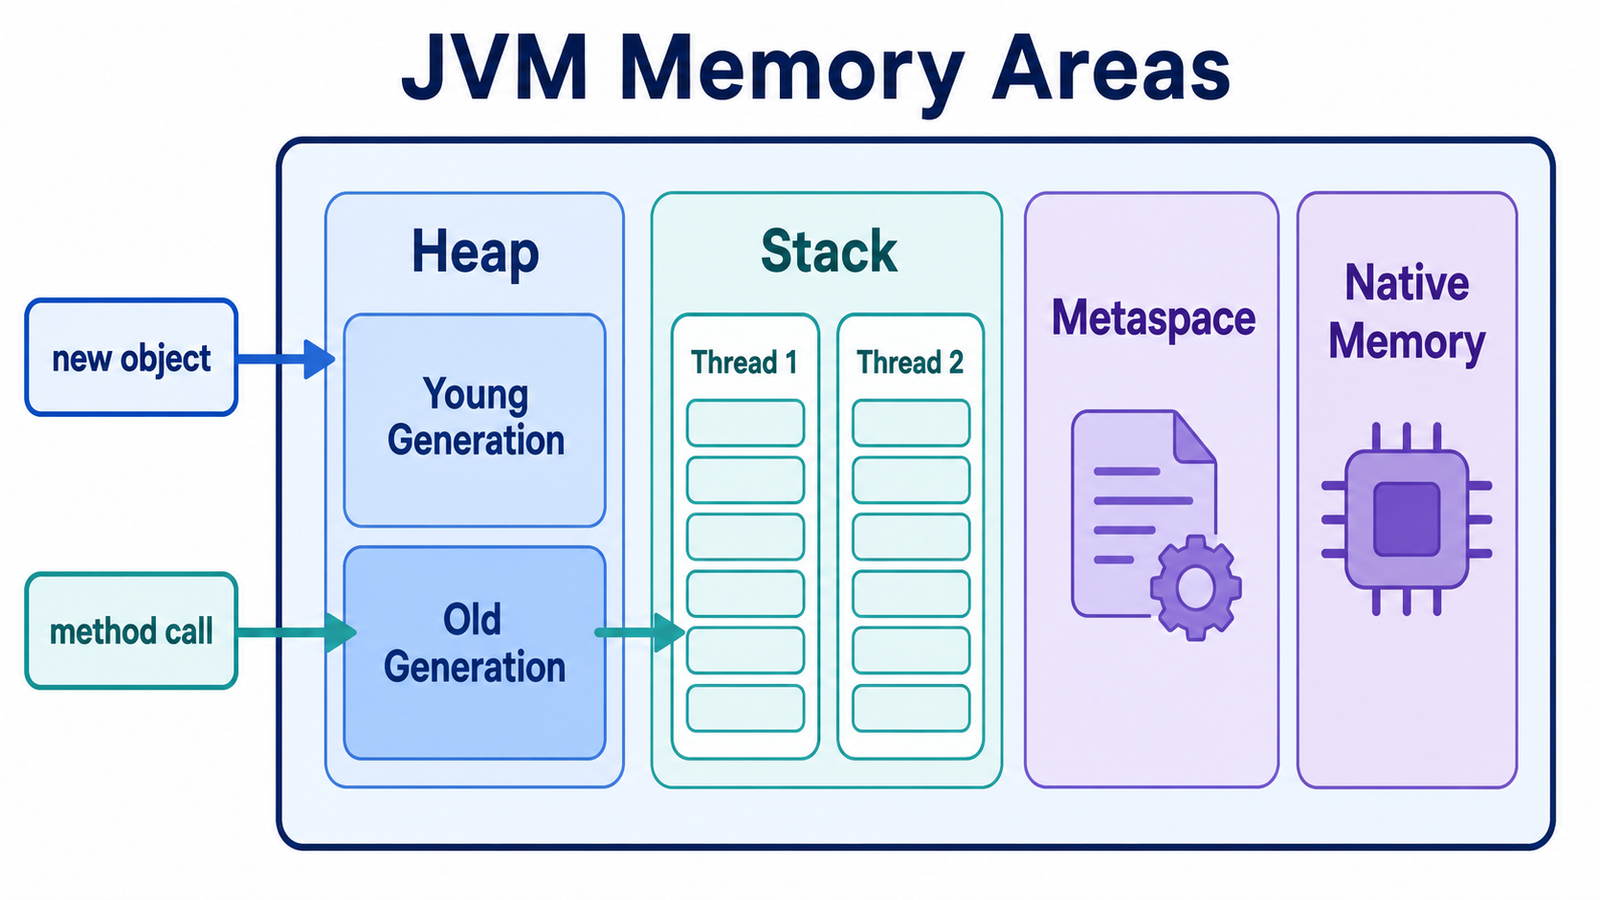
The JVM divides its memory into distinct runtime data areas, each serving a specific purpose.
| Area | Shared? | Purpose |
|---|---|---|
| Method Area (Metaspace in Java 8+) | All threads | Stores class metadata, static variables, constant pool, and method bytecode. |
| Heap | All threads | Dynamic storage for all object instances and arrays. Subject to garbage collection. |
| Stack (JVM Stack) | Per thread | Holds stack frames for each method call: local variables, operand stack, return address. |
| PC Register | Per thread | Stores the address of the currently executing JVM instruction for each thread. |
| Native Method Stack | Per thread | Supports native (non-Java) methods invoked via JNI (Java Native Interface). |
3. Stack Memory
Each thread in Java has its own stack that operates on a Last-In-First-Out (LIFO) basis. Every time a method is called, a new stack frame is pushed onto the stack. When the method returns, its frame is popped off and all its local data is immediately discarded.
A stack frame holds:
-
Local primitive variables —
int,double,boolean, etc. stored directly by value. - Object references — variables that point to objects on the heap (the reference itself lives on the stack).
- Method return address — where execution resumes after the method returns.
- Operand stack — scratch space used during expression evaluation.
public class StackDemo {
    public static void main(String[] args) {
        int x = 10;         // x stored on stack
        int y = compute(x); // new frame pushed for compute()
        System.out.println(y);
    }

    static int compute(int n) {
        int result = n * 2; // result stored in compute's frame
        return result;      // frame popped after return
    }
}
StackOverflowError: If method calls recurse too
deeply (e.g., infinite recursion), the stack runs out of space
and the JVM throws a
StackOverflowError.
4. Heap Memory
The heap is the JVM's largest memory area — a single region shared by all threads where all object instances live. The Garbage Collector manages the heap and organizes it into generations to optimize collection frequency and pause times.
  +---------------------------------------------------------+
  ¦                         HEAP                            ¦
  ¦  +----------------------+  +--------------------------+ ¦
  ¦  ¦     Young Generation ¦  ¦    Old Generation        ¦ ¦
  ¦  ¦  +----+ +----------+ ¦  ¦  (Tenured Space)         ¦ ¦
  ¦  ¦  ¦Eden¦ ¦Survivor  ¦ ¦  ¦  Long-lived objects      ¦ ¦
  ¦  ¦  ¦    ¦ ¦S0  ¦  S1 ¦ ¦  ¦  promoted from Young Gen ¦ ¦
  ¦  ¦  +----+ +----------+ ¦  +--------------------------+ ¦
  ¦  +----------------------+                               ¦
  ¦  +--------------------------------------------------+   ¦
  ¦  ¦   Metaspace (off-heap in Java 8+)                ¦   ¦
  ¦  ¦   Class metadata, static fields, interned strings¦   ¦
  ¦  +--------------------------------------------------+   ¦
  +---------------------------------------------------------+
- Eden Space: Where new objects are initially allocated.
- Survivor Spaces (S0, S1): Objects that survive a minor GC are moved here before promotion.
- Old Generation: Objects that have survived multiple GC cycles are promoted here. Collected less frequently.
- Metaspace: Holds class metadata. Uses native memory (not the Java heap), growing dynamically by default.
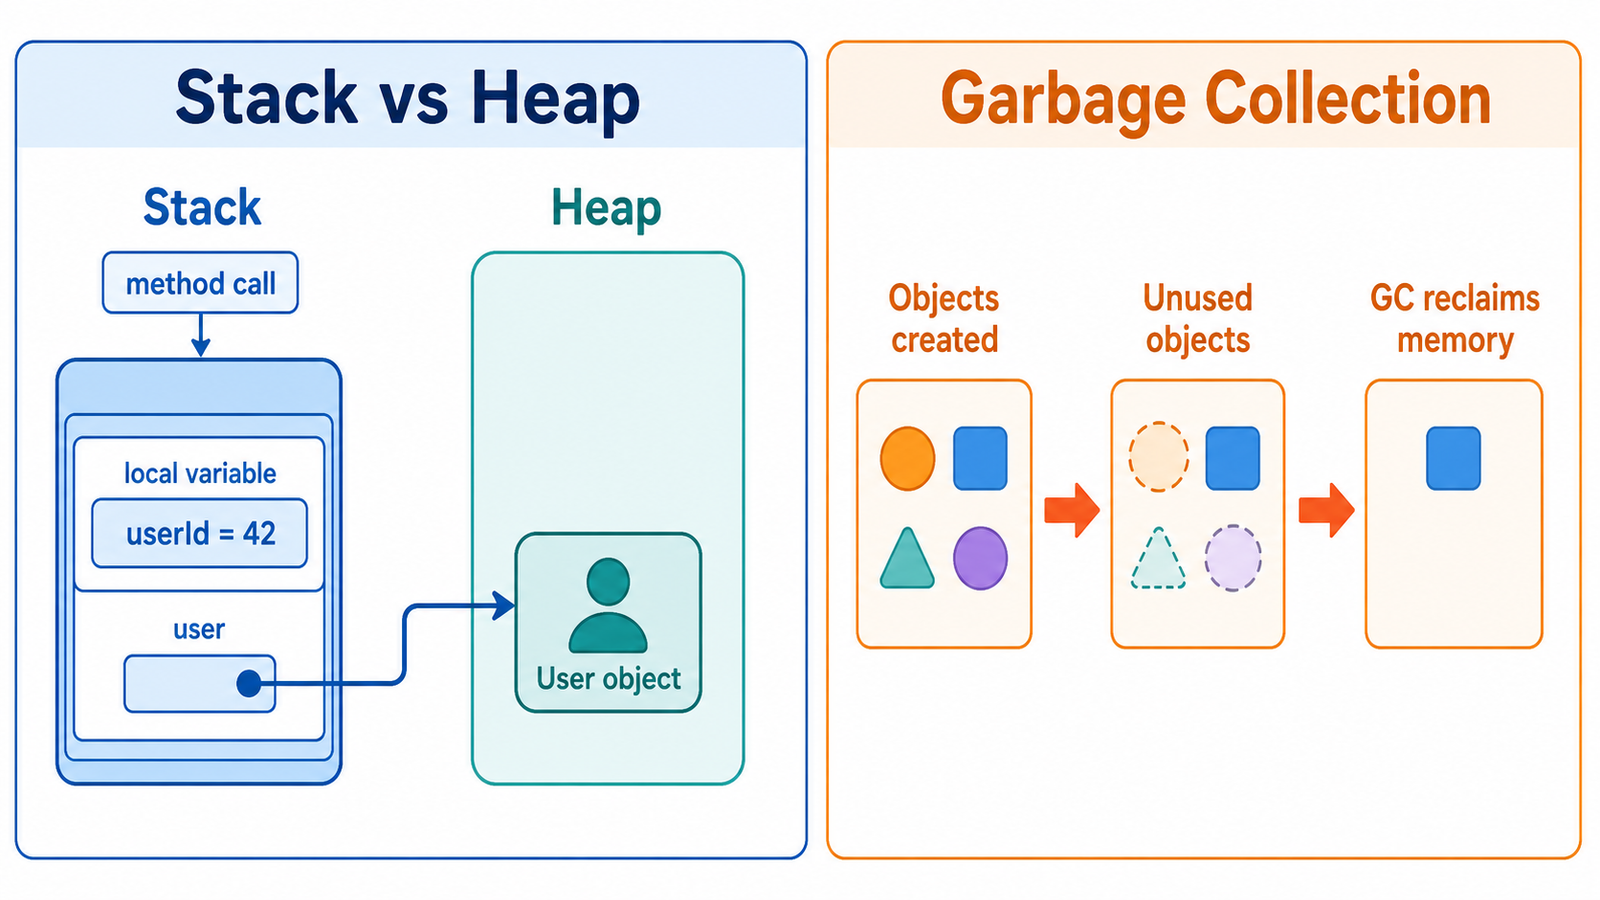
5. Stack vs Heap
| Aspect | Stack | Heap |
|---|---|---|
| Lifetime | Duration of the method call | Until the object is garbage collected |
| Access Speed | Very fast (LIFO pointer arithmetic) | Slower (dynamic allocation and GC overhead) |
| Thread Safety | Thread-private — no sharing | Shared across all threads — synchronization needed |
| What's Stored | Local primitives and object references | Object instances and arrays |
| Size | Small and fixed (typically 512 KB–1 MB) |
Large and configurable (-Xmx
flag)
|
| Overflow Error | StackOverflowError |
OutOfMemoryError |
6. How Java Objects are Stored
When you write new MyClass(), the JVM
allocates space for the object on the heap and
returns a reference. The reference variable itself lives on the
stack (or inside another heap object).
public class ObjectStorage {
    public static void main(String[] args) {
        // 'name' reference lives on stack
        // "Alice" String object lives on heap
        String name = new String("Alice");

        // 'p' reference lives on stack
        // Person object lives on heap
        Person p = new Person("Alice", 30);
    }
}

class Person {
    String name;  // reference field — lives inside Person object on heap
    int age;      // primitive field — embedded in Person object on heap
    Person(String n, int a) { name = n; age = a; }
}
  STACK (main frame)          HEAP
  +----------------+          +-----------------------+
  ¦ name ----------+---------?¦ String "Alice"        ¦
  ¦ p    ----------+----+     +-----------------------+
  +----------------+    ¦     +-----------------------+
                        +----?¦ Person object         ¦
                              ¦   age  = 30           ¦
                              ¦   name --------------?¦ String "Alice"
                              +-----------------------+
Primitives vs Objects: Primitive types (int, double, etc.) declared as local
variables live directly on the stack. When declared as fields of
an object, they are embedded within the object on the heap.
7. Garbage Collection
The Garbage Collector automatically identifies and reclaims heap memory occupied by objects that are no longer reachable from any live reference. An object becomes eligible for GC when:
-
Nulled reference: The reference is explicitly
set to
null. - Out of scope: The reference variable goes out of scope (method returns, block ends).
- Island of isolation: A group of objects only reference each other but are not reachable from any GC root (thread stacks, static fields).
- Re-assigned reference: A reference is reassigned to point to a different object.
public class GCDemo {
    public static void main(String[] args) {
        // Case 1: null assignment
        Object a = new Object();
        a = null;  // original Object now eligible for GC

        // Case 2: re-assignment
        String s = new String("hello");
        s = new String("world");  // "hello" now eligible for GC

        // Case 3: out of scope
        {
            Object b = new Object();
        } // b is out of scope here — Object eligible for GC

        // Suggest GC (no guarantee it will run immediately)
        System.gc();
    }
}
System.gc(): Calling
System.gc() is only a
hint to the JVM. The JVM may ignore it. Never rely on
explicit GC calls in production code; trust the JVM to manage
collection timing.
8. GC Algorithms
The JVM ships with several garbage collector implementations, each suited to different workloads.
| GC Algorithm | JVM Flag | Best For | Pause Behavior |
|---|---|---|---|
| Serial GC | -XX:+UseSerialGC |
Single-threaded apps, small heaps, client-side tools | Stop-the-world; single thread |
| Parallel GC | -XX:+UseParallelGC |
Throughput-focused batch jobs; default in Java 8 | Stop-the-world; multiple threads |
| G1 GC | -XX:+UseG1GC |
Large heaps (>4 GB), low-latency server apps; default in Java 9+ | Concurrent + short pauses |
| ZGC | -XX:+UseZGC |
Ultra-low latency; very large heaps (>8 GB); Java 15+ production | Sub-millisecond pauses |
9. Memory Leaks in Java
Even though Java has a garbage collector, memory leaks are still possible. A leak occurs when objects remain reachable but are no longer needed — the GC cannot collect them because there is still a live reference.
Common Causes
-
Static collections: Storing objects in a
staticListorMapwithout removing them. The static field is always a GC root, so every entry stays reachable forever. -
Unclosed streams and connections:
InputStream,Connection, orResultSetobjects keep internal buffers alive until explicitly closed. - Event listeners / callbacks: Registering a listener without deregistering it keeps the listener and its referenced objects reachable for the lifetime of the event source.
-
ThreadLocal variables: Values stored in
ThreadLocalon thread-pool threads are never cleaned up unless explicitly removed. - Inner class references: Anonymous and non-static inner classes hold an implicit reference to their enclosing class, preventing the outer object from being collected.
How to Detect Memory Leaks
- Use heap dump analysis with tools like Eclipse MAT (Memory Analyzer Tool) or VisualVM.
- Monitor heap usage over time — a continuously growing heap that never drops after GC is a strong indicator of a leak.
-
Use JVM flags like
-verbose:gcor-XX:+PrintGCDetailsto observe GC behavior. - Use profilers like YourKit, JProfiler, or Java Flight Recorder (JFR).
10. Best Practices
Close Resources with try-with-resources
Always use try-with-resources for objects that implement
AutoCloseable (streams, connections,
readers). This guarantees the resource is closed even if an
exception occurs.
// BAD: resource may never be closed if exception thrown
FileInputStream fis = new FileInputStream("data.txt");
int data = fis.read();
fis.close();

// GOOD: always closed automatically
try (FileInputStream fis = new FileInputStream("data.txt")) {
    int data = fis.read();
} // fis.close() called here automatically
Avoid Unnecessary Object Creation
Prefer reusing objects over creating new ones in tight loops. For
example, use StringBuilder instead of
string concatenation inside a loop.
// BAD: creates a new String object on every iteration
String result = "";
for (int i = 0; i < 1000; i++) {
    result += i;  // O(n^2) allocations
}

// GOOD: single StringBuilder reused
StringBuilder sb = new StringBuilder();
for (int i = 0; i < 1000; i++) {
    sb.append(i);
}
String result2 = sb.toString();
Use Primitives Where Possible
Prefer int over
Integer,
double over
Double, etc. Autoboxing creates
wrapper objects on the heap. In performance-sensitive code,
accumulating millions of autoboxed values can cause significant GC
pressure.
// BAD: autoboxing creates Integer objects
List<Integer> list = new ArrayList<>();
for (int i = 0; i < 1_000_000; i++) {
    list.add(i);  // each 'i' is autoboxed to new Integer(i)
}

// BETTER: use primitive array when appropriate
int[] arr = new int[1_000_000];
for (int i = 0; i < arr.length; i++) {
    arr[i] = i;  // no object allocation
}
JVM Tuning: Set initial heap size with
-Xms and maximum heap with
-Xmx. For example,
-Xms256m -Xmx2g starts with 256 MB
and allows growth up to 2 GB. Setting them equal avoids costly
heap resize operations at runtime.